Application – Any Bar Style
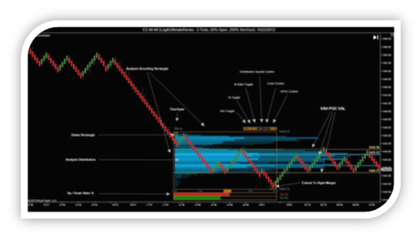
The LogikVolumeWand is a feature rich volume / tick / price distribution analysis tool. It displays volume / tick distribution information computed within the user drawn rectangle, combining the usefulness of Volume Point of Control, Volume Delta, and Volume Footprint analysis into one intuitive tool. The user may manage as many volume analysis boxes as desired, at either a focused region of one bar, or large region transpiring over any range of time. Below is an image of the wands feature rich interface and data analysis presentation.
There are two version of the LogikVolumeWand available, the regular version and the HD version. The difference between the two is accuracy; the HD version utilizes tick data for computations while the non-HD version does not. More info on the differences below. When you purchase the HD version, you get the non-HD version as well as it is just as useful and has its pros over as well.
As noted above, the LogikVolumeWand allows the user to perform volume profile over any size price / time region. The LogikVolumeWand comes in two versions. The LogikVolumeWand, and the LogikVolumeWand HD. Both versions pack the same features, however the HD version provides the additional feature of utilizing tick data to provide a higher degree of accuracy. Of course the addition of Tick data increases CPU usage and therefore chart initial load time.
Below is a description of the LogikVolumeWand. As mentioned earlier, algorithmic computations are performed with the data within the analysis bounding rectangle.
- This rectangle is drawn once per Wand you wish to control. To initiate, click the LogikVolumeWand button on the toolbar, click the chart and move the mouse to the desired location. To initiate another, simply repeat this procedure.
- The analysis calculations are updated on the fly as the user resizes / moves the rectangle.
- The analysis is performed based on the data within the bounds of the rectangle.
- Moving the Rectangle
- Once the rectangle is drawn, the user may mouse click and drag over either vertical or horizontal side of the rectangle to move it. The side will highlight as the user hovers over it.
- Sizing / Resizing the Rectangle
- In order to resize the rectangle, the user may mouse click and drag over any corner of the rectangle, and drag the corner to the desired size. The corner will highlight as the user hovers over it.
- Illustrates the analysis distribution over the bounding rectangle. Options include
- LogikVolumeWand Version
- VOC – All the volume of a bar gets applied into the closing price of that bar.
- TPO – Each price in the range of a bar gets a single hit (disregards volume).
- VWTPO – Each price in the range of a bar gets an equally divided portion of the bar’s volume
- VTPO – All the volume of a bar gets applied to each price in the range of the bar
- LogikVolumeWand HD Version
- VOLUME – Each price is given the volume at that price
- TRADES – Each price is given a single hit
- Buyer Seller Histogram Display Mode (HD version only)
- VERTICAL Buy vs Sell
- Histogram will be split in the middle and centered within the wand with Buyers shown on the left side and Sellers will be shown on the right side.
- VERTICAL Winner
- Histogram will be split in the middle and centered within the wand but the side for which Buyers and Sellers are displayed on the right is dependent on which is larger (considered the winner) at the specified Bin.
- HORIZONTAL
- This mode shows the Ratio of Buyers to Sellers horizontally for each histogram bar with the outline of the histogram bar colored in the buyer or seller color depending on who is influencing the market.
- If shortcuts are enabled, Control + B keyboard combo shortcut can be used in order to switch Buyer Seller Histogram Display Mode.
- VERTICAL Buy vs Sell
- Display the Up vs. Down Ratio via histogram and numeric values.
- LogikVolumeWand Version – Ratio is based on Bars
- LogikVolumeWandHD Version – Ratio is based on Ticks
- Weighted / Non Weighted by volume
- Three lines are displayed.
- Value Area High
- Point of Control
- Value Area Low
On The Fly Controls
- Info Toggle – Toggle on / off the time and high / low price display
- % Toggle – Toggle on / off the Histogram measure %
- % Ratio Toggle – Toggle on / off the Up / Down Ratio % Histogram
- Distribution Opacity Control – Select manual opacity level or auto opacity level
- Color Control – Select grayscale, input color, or multi-color wheel
- VPOC Control – Select VPOC display off / rectangle bounded / extend to margin
Extend to Right Margin
- Allows the user to select 4 levels of how the distribution is displayed.
- Each level pushes the distribution closer to the price margin
Delete Analysis Rectangle
- Allows the user to remove an Analysis rectangle