
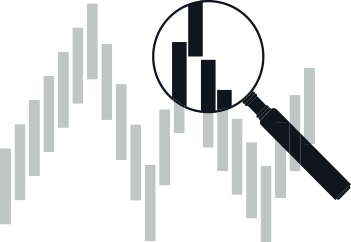
The LogikBarProfiler is a feature rich bar volume / tick / price distribution Heads up Display (HUD) analysis tool. It displays volume / tick distribution information computed within each price bar, as well as Buyer vs Seller distribution at each user defined cell size. This combines the usefulness of Volume Point of Control, Volume Delta, and Volume Activity analysis into one intuitive tool.
$297.00
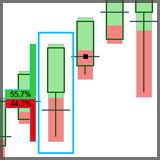
Volume Distribution & Activity Cells + Buy / Sell Pressure
The addition of the Buy / Sell Pressure overlay to the Volume Distribution & Activity Cells incorporates the Buy / Sell Ratio at each defined price level. The addition of this information expands the usefulness of the activity cells to indicate direction at each price, indicating whether buyers or sellers were in control at that particular price.
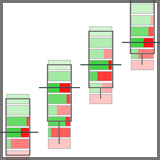
Volume Distribution & Activity Cells
The Volume Distribution & Activity cells option displays the transaction activity that occurs at each price within the bar. This information is displayed as an overlay on top of the bar for the user to quickly identify where the Point of Control is, and which prices are also of more value as the gradient of each cell represents the activity behind the price.
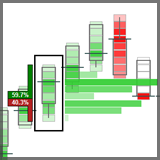
Volume Up / Down Ratio
The Volume Up / Down Ratio option displays the ratio of buys vs. sells transactions that occur within the price bar. This information is displayed as an overlay on top of the bar for the user to quickly identify who is in control
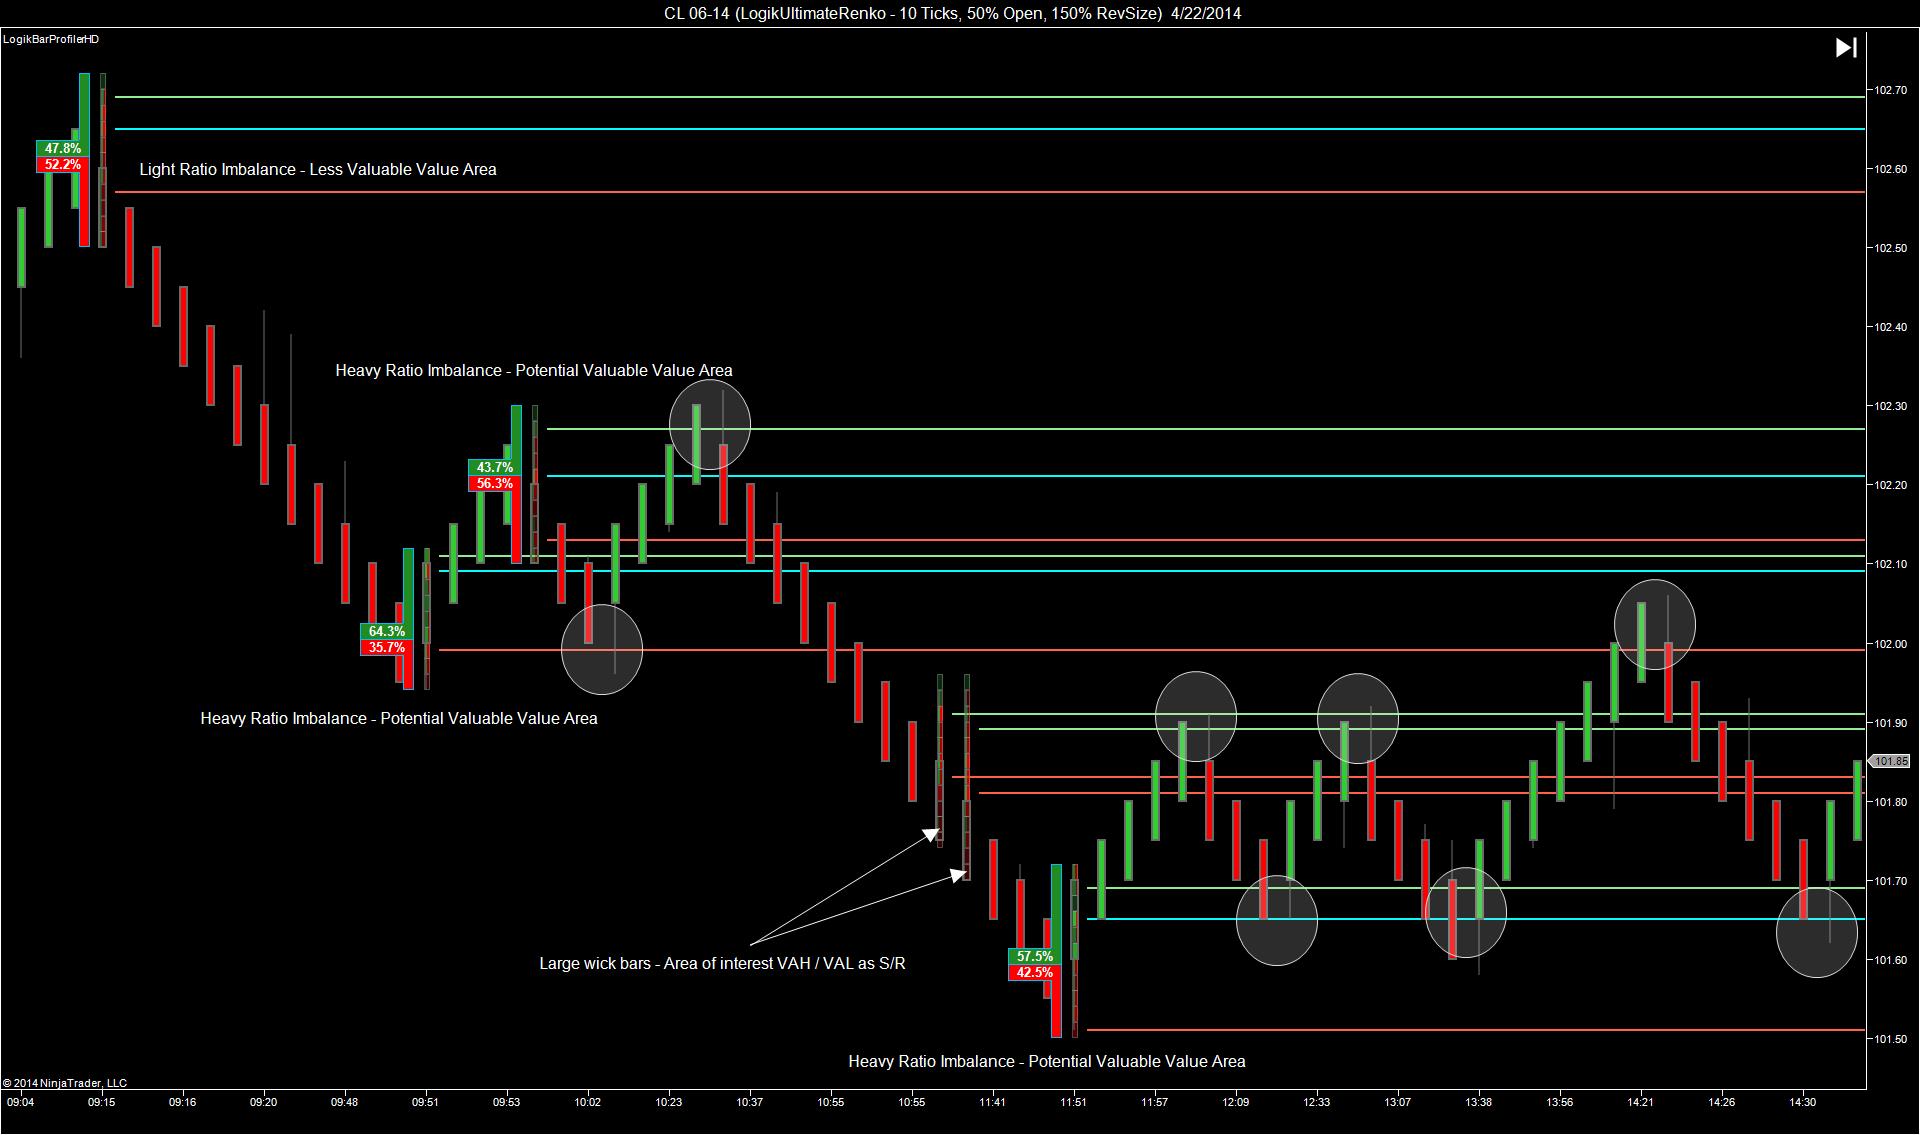
Bar POC, VAH, VAL
Utilizing the turning point bars volume statistics, we can create the Value Area Low, Value Area High, and Point of Control. These statistically accurate volume at price points are more meaningful in determining true support / resistance, and can lead to more accurate turning point predictions
Overview
There are three main functions of the LogikBarProfiler. The HUD allows you to analyze all three at the same time, with the addition of on-the- fly hot key control to quickly switch between primary and ancillary display. This allows the user to present what he believes to be the most useful for his trading method as the primary view, while maintaining the other visual data features at the same time. Users can toggle between a distribution breakdown view, and a total percentage of up ticks and down ticks view, using ‘CTRL-SPACE’
The Point of Control hash mark begin shows the actual price inside of a consolidation range that market makers are accumulating or distributing their positions. These POC clusters are especially useful when trading trend pullbacks into prior support or resistance. Where most traders place their entries at the tops or bottoms of previous consolidation – LogikBarProfile traders will see the truer entry several ticks up or down into the consolidation block
Watch a tutorial on using