NinjaTrader(TM) charts are extremely flexible, customizable and user-friendly allowing you to visualize market data in a manner that is right for you. If you have an idea that you require consulting assistance to design and develop, we have the industry knowledge and experience you need.
Data Visualization
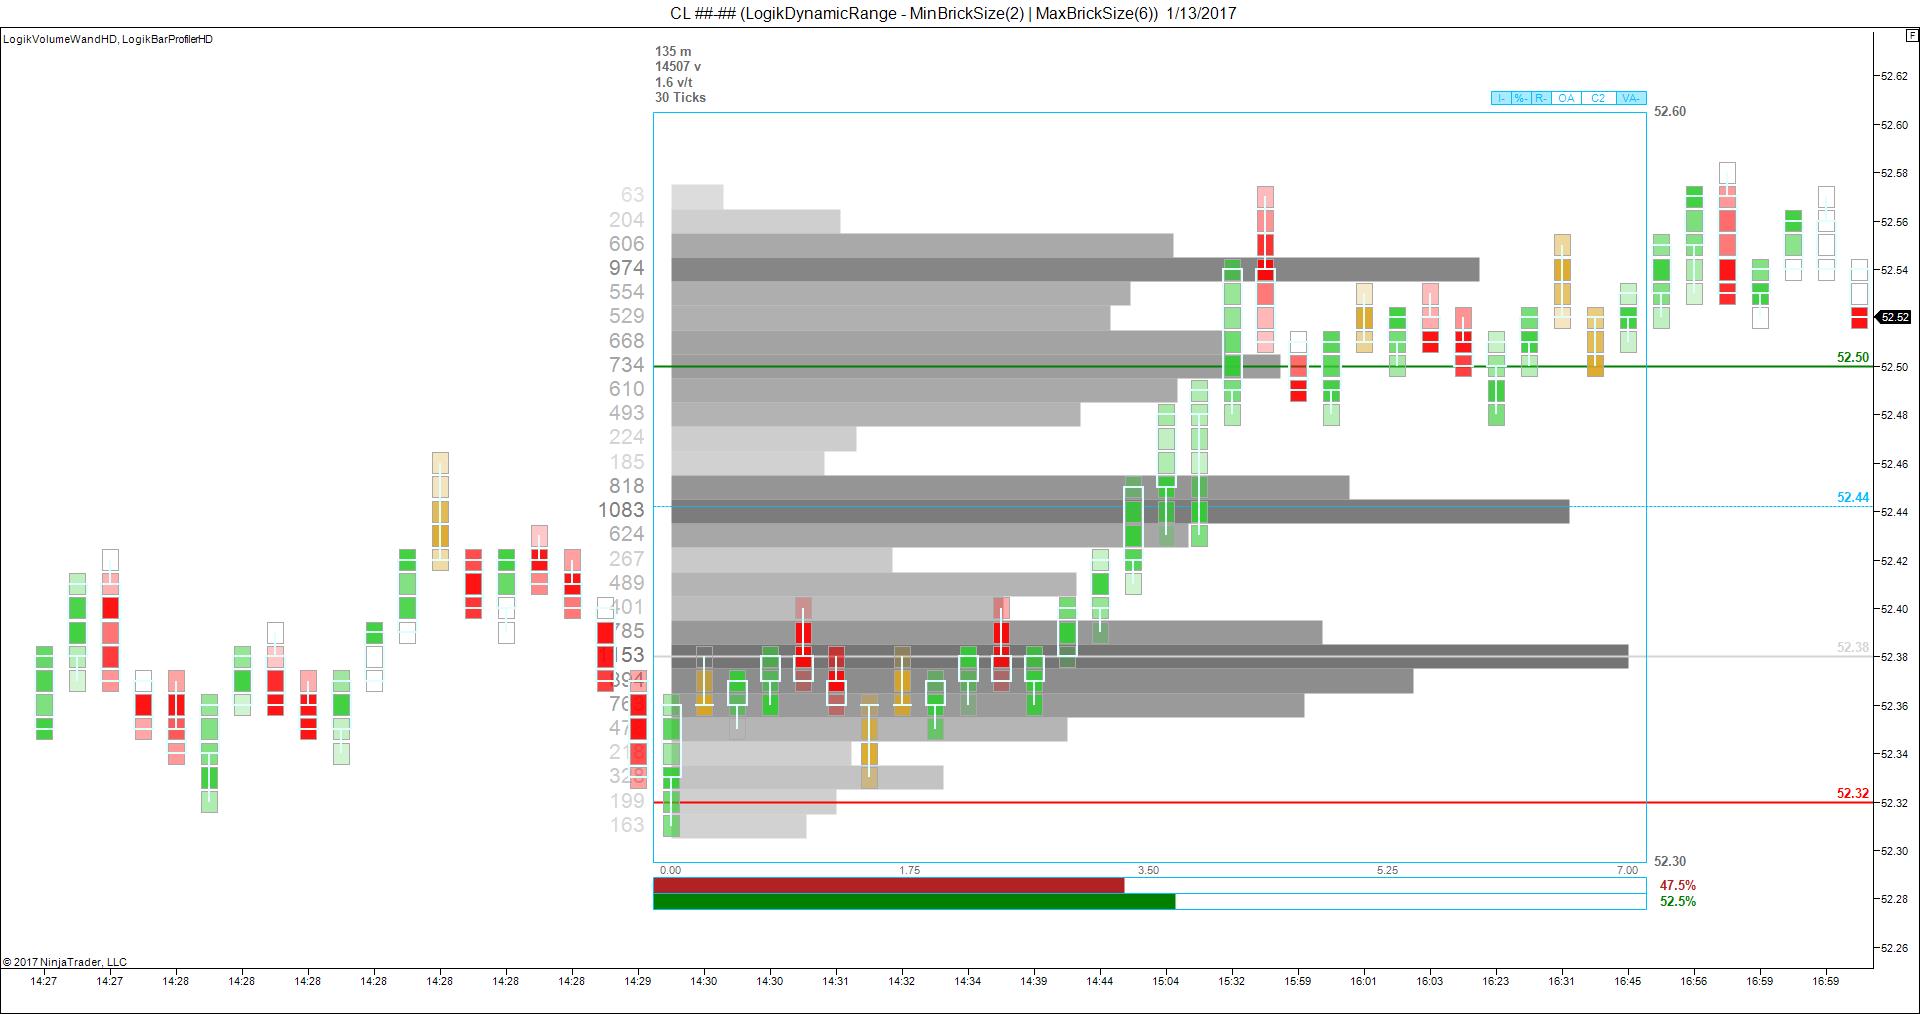
We believe how data is displayed is just as important as the data itself. We specialize in custom graphics, which can be as simple as a cleaner, more visually appealing region of price action, to a more complicated histogram like the LogikVolumeWand and LogikBarProfilier (displayed at the left). This is an example of NinjaTrader’s customization possibilities at its finest, showing many different data statistics in a clear and concise manner.
Some of What we Do
BarTypes
Indicators
Conditional Alerts
Custom Plots / Markers
Multiple Time Frame Transposition
Globalizing Indicator Data
External Application Integration
Modifying any existing indicator
Indicator conversion from another trading platform
Designing, developing, and testing of an indicator design idea
Custom created indicators are delivered as open source, unless they utilize one of our proprietary algorithms.