
The LogikVolumeWand is a feature rich volume / tick / price distribution analysis tool. It displays volume / tick distribution information computed within the user drawn rectangle, combining the usefulness of Volume Point of Control, Volume Delta, and Volume Footprint analysis into one intuitive tool. The user may manage as many volume analysis boxes as desired, at either a focused region of one bar, or large region transpiring over any range of time.
$397.00
Volume Fundamentals
Volume Profile provides Point of Control, Value Area High, and Value Area Low price points. These price points indicate the prices at which the maximum cleared volume traded, and a 70% region around that maximum cleared volume. This helps define true support and resistance not only by price peaks and valleys, but more substantially by indicating where the market volume focus was.
Micro / Macro Analysis
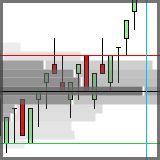
Volume Profile analysis bound by swing points rather than day range minimizes the frequency of a non-equilibrium distribution, the primary limitation as described by Steidlmayer. That is, having a non-equilibrium distribution means there is no clear direction of market participants. Using swing points allows a trader to hone in on a price region to find a clear distribution.
Additionally, a single day’s volume profile does not provide a reliable measure of volume profile. Research indicates that a three day measure is the minimum preferred.
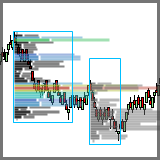
Profile Confluence
Overlaying Profile regions from Three-Day to swing bound allows a trader to identify the intersection of the major and the minor Points of Control, as well as High and Low Value areas of interest, giving a bigger picture of what market participants are doing in order to better forecast market movement.
Overview
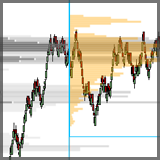
The LogikVolumeWand is an intuitive Volume Profile tool that allows a trader to view what market participants are doing over a specific price / time region. The inventor of Volume Profile, Peter Steidlmayer, claimed that “a key element [in Volume Profile Analysis] is the Initial Balance; the range and price location of the first hour of trading.” If this is the case, why are all Volume Profile tools statically linked to the entire day of trading time, rather than modifiable to represent important time periods, or price vacillations? The LogikVolumeWand changes this.
Below is an image of the wands feature rich interface and data analysis presentation.
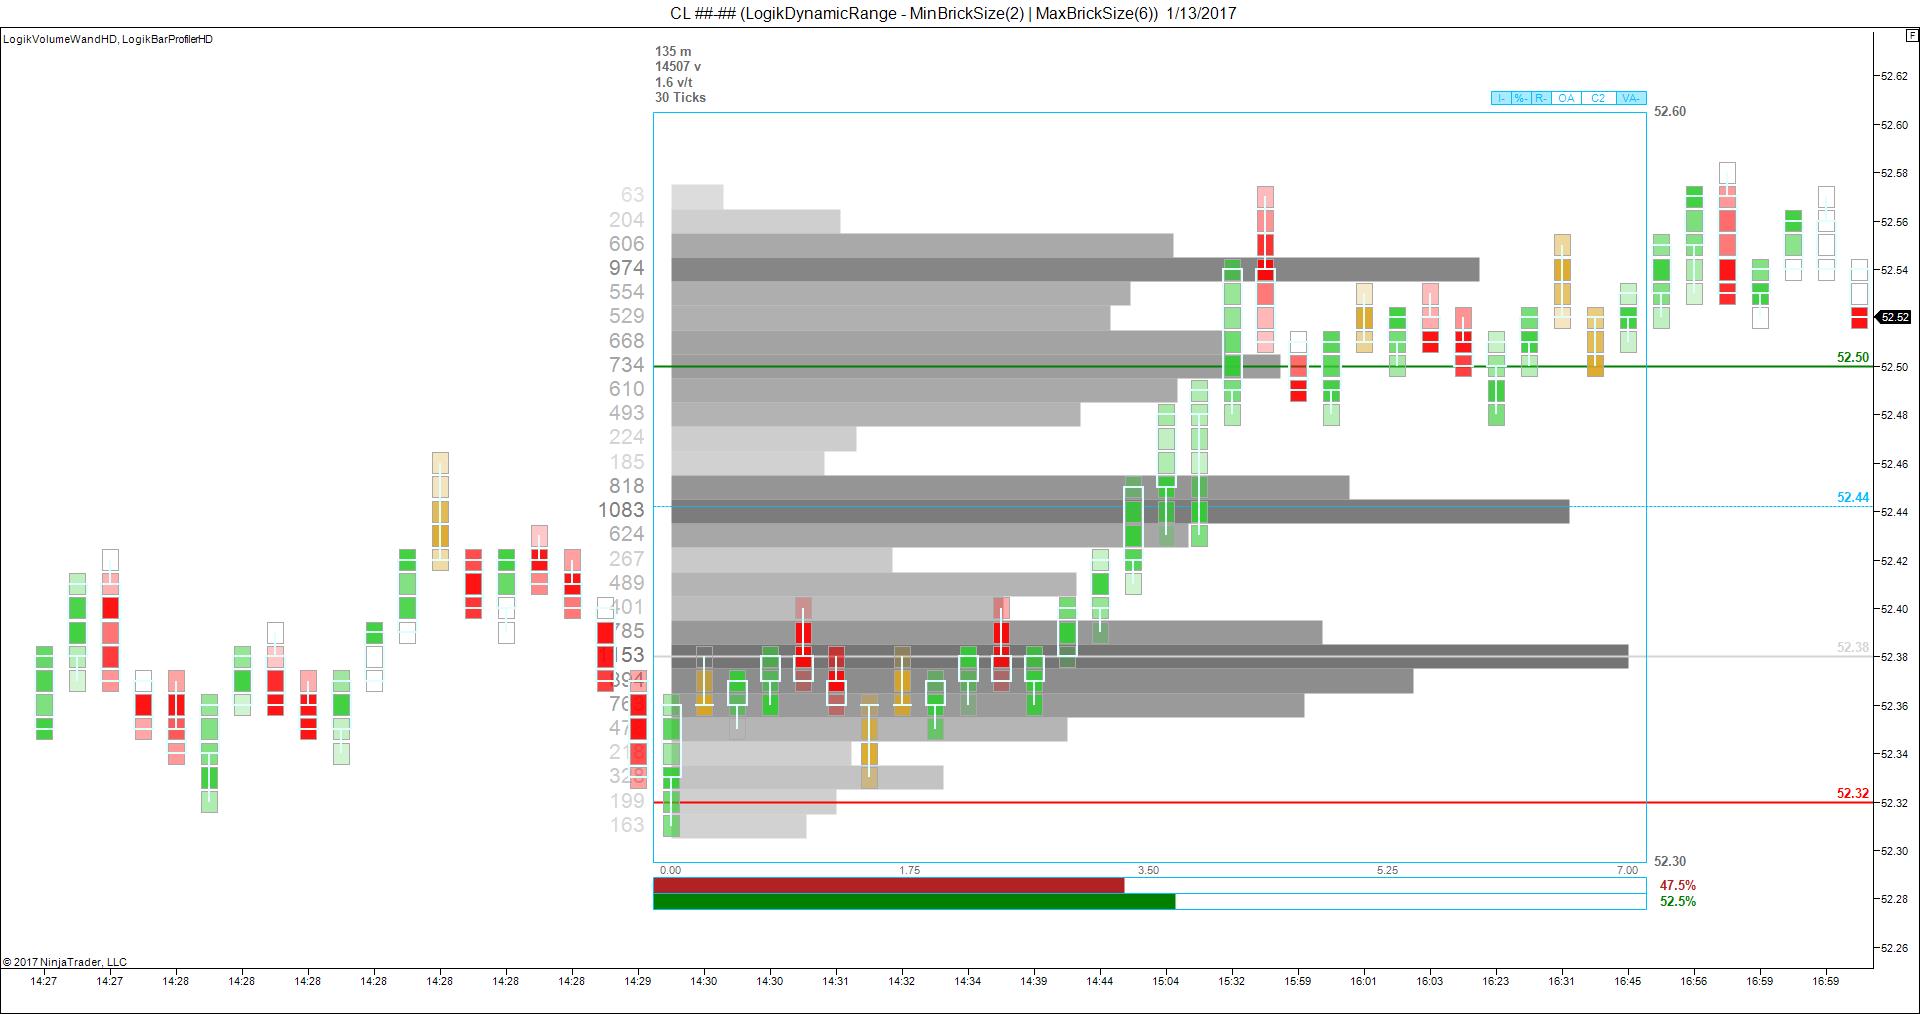
Watch a tutorial on using
![]()